Power curves in Redash with Clickhouse
Posted on by álvaro
There is a lot written on the internet regarding power curves. They are a very powerful tool to better understand how users of a service are behaving. Do you have a strong small user base? Are they more evenly distributed? With traditional Monthly Active User (MAU) you don’t get to know it. Power curves are easy to calculate. While I was working at FWD we implemented them in Clickhouse and displayed them with Redash. This is a small write up just in case it helps anyone implementing them.
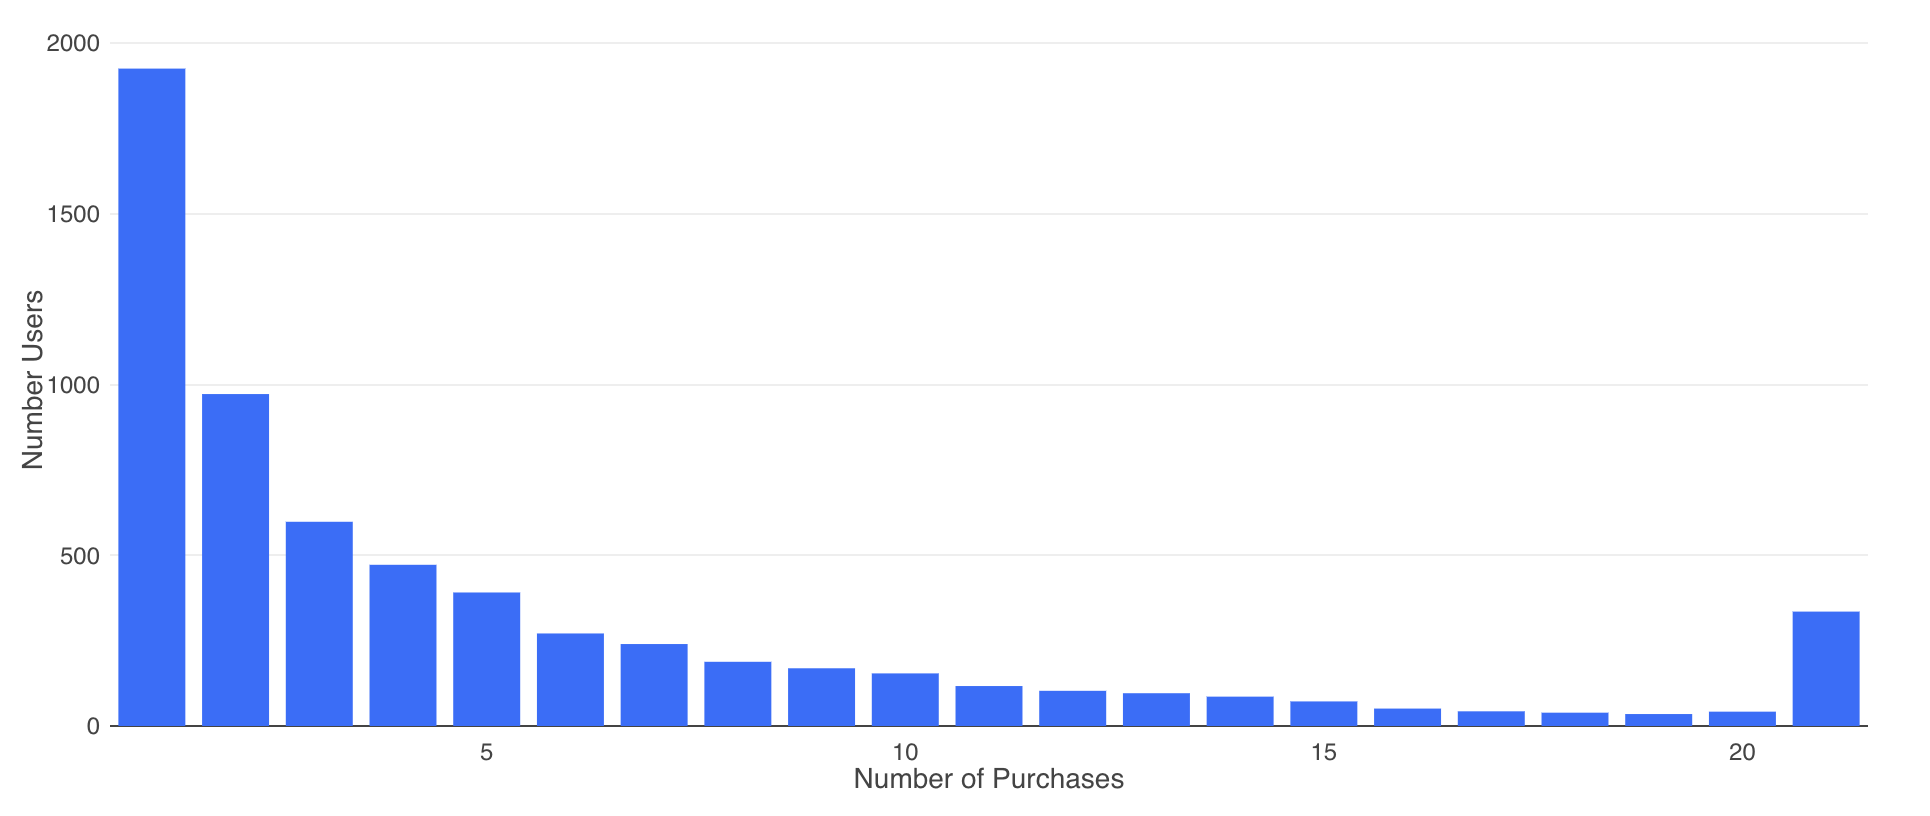
You can display many things with power curves. How many service interactions per user during a month? How many purchases per user per month? Or whatever other measure that might make sense for your product. In this entry, we are going to measure how many purchases per user in the last 30 days. We will get something like:
Our assumption for this exercise is that in Clickhouse we have a tabled called Purchases that contains all the purchases of the system (lets assume only successful ones). Each user has a unique identifier that we call AccountID.
There is a small detail that will complicate a little the query, but it will make it more powerful. In the power cuve we are going to count:
- How many users purchased 1 in a month.
- How many users purchased 2 in a month.
- How many users purchased 3 in a month.
- …
- But we don’t know what is the maximum number of purchases.
We have two options, either we can hard code a value that will be used to group the most powerful users (eg: for the the ones who purchased 10+), or we can calculate that value on the fly (in the pic above the top bucket is 21).
    ( SELECT /*
         Calculate the place where we are going to group the top buyers
        */
        toUInt64(floor(quantileTDigest(0.95)(Purchases))) AS MaxPurchases
       FROM
         ( SELECT AccountID,
                  count() AS Purchases
          FROM Purchases
          WHERE EventDate >= today() - 30
          GROUP BY AccountID )
     )
In this query, we are calculating the top bucket we will use later in the final grouping. For that first we count how many purchases each user has done during the period we are looking at (in this case the last 30 days). Once we have amount of purchases per user, we want to know how the minimum purchases of the top 5% of buyers. We have the nice quantileTDigest to calculate what is the 0.95 quantile of the purchases of all buyers. Once calculated we just round it down, and convert to an int. The result of this query will tell us how many purchases did our top 5% of buyers, which is in MaxPurchases.
We have to pass now MaxPurchases to the next query. We are still using an old version of Clickhouse. The SQL has improved a lot in the newer versions. But for different reasons we never updated our cluster. Hence we use a small trick that might not be needed now. To do a JOIN we are going to add a dummy column that will be used for the join.
The resulting query is like this:
    SELECT
        if(Purchases > MaxPurchases, MaxPurchases, Purchases) as Purchases, /* assign a bucket */
        count() as Users
    FROM (
      /* count purchases per user */
      SELECT AccountID,
               count() AS Purchases,
               1 AS dummy   /* dummy join param */
       FROM Purchases
       WHERE EventDate >= today() - 30
       GROUP BY AccountID
    )
    ALL INNER JOIN
      ( SELECT
        toUInt64(floor(quantileTDigest(0.95)(Purchases))) AS MaxPurchases,
        1 AS dummy   /* dummy join param */
       FROM
         ( SELECT AccountID,
                  count() AS Purchases
          FROM Purchases
          WHERE EventDate >= today() - 30
          GROUP BY AccountID )
     )
     USING dummy  /* dummy dummy here also */
    GROUP BY Purchases, MaxPurchases
    ORDER BY Purchases
In the first part of the query we count again the purchases per user in the given time period. We JOIN with the query we did above so each row will get also the MaxPurchases. We have just one last step, which is assign a bucket and do the final grouping. We use the handy if function to group the top 5% in the top bucket.
We are ready, now you have the power curve of purchases. There is one important thing that you will need to take into account. There is no bucket 0. We are counting the distribution of the buyers here, not all our user base. In this case adding a bucket 0 is not that easy as in the Purchases table we have only information of the users who did a purchase. If you will need the bucket 0, it depends a lot on your DB and what information you store. But it is important to take into account, as you are only displaying the “good” users (or the ones buying in this example).
With Redash it is very easy to get the graph. You are done.
I hope it helps!!
Note: As mentioned above in later versions of Clickhouse there is also the WITH support that could be used to simplify the queries.