Unifying health checks in services
Posted on by álvaro
Microservices became very trendy. Nowadays every company says it is using them. They can scale your organization, make your life better and solve world hunger. No matter if it is true or not, and if the services are micro or not, usually no one talks about how to know if they are healthy or not. Both Kubernetes and Mesos/Marathon provide health and/or readiness checks to know if a task is doing ok and ready to serve traffic. Google introduced some time ago their healthz endpoints. We took it as inspiration and built our own standard way to provide a unified health view for our services. We built hlthrr package. And then use the standardized endpoints as the usual Marahon health checks.
The idea behind hlthrr is two fold:
- Each service is responsible to inform if it is healthy (and useful). And that does not mean that the process is up and running only, but also that all the dependencies (other services, DBs, etc.) are accessible and the service can do what it is supposed to.
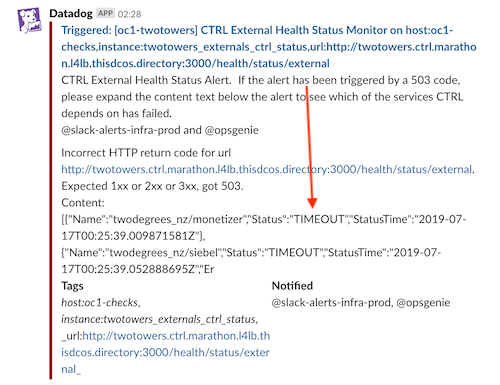
- To make engineers lives easier. The response from hlthrr endpoints are in json format and easy readable. The endpoints are always the same, so it is easy to manually check. And not only that, in case of failure, our alerts get the body of the hlthrr response and includes it on the message. That way when on call, you get in Slack also the reason of the failure. It gives the person a fast first context to evaluate the severity of the alert.
hlthrr has provides two endpoints (that you can attach either to your current server, or create a new one on a different port so you can easily hide it from the outside). The first one is /health/up which responds with OK to a GET or HEAD as long as the process is running. The second one is health/status. The response of a GET depends on the status of the registered checks. If all OK then it will be a 200 OK, and if there is an error it will respond with a 503 Service Unavailable. An example of the output of a check could be:
[
    {
        "Name": "Mongo",
        "Status": "OK",
        "StatusTime": "2019-07-19T09:27:56.452575294Z"
    },
    {
        "Name": "kafkaProducer",
        "Status": "OK",
        "StatusTime": "2019-07-19T09:27:56.441667598Z"
    },
    {
        "Name": "redis",
        "Status": "OK",
        "StatusTime": "2019-07-19T09:27:56.441085098Z"
    }
]
And in Slack we get alerts like this (errors are always first so they don’t get truncated):
Registering a service to be checked with hlthrr is as simple as passing a function with the signature:
func() errorAnd registering it and starting the server:
hr := hlthrr.NewRegistry()
healthChecker := hlthrr.NewMonitor(ctx, hr, hlthrr.Config{Path: "/health/"}, log.New("@", "health"))
hr.Register(
    hlthrr.Endpoint{
        Name:    "kafkaConsumer",
        Tags:    []string{hlthrr.TagInternal, hlthrr.TagRequired},
        Checker: c.Status,
    })

go func() {
    hr.Start()
    err = http.ListenAndServe(":"+strconv.Itoa(getHealthPort()), healthChecker.GetHTTPHandler())
    if err != nil {
        panic("init-health-interface err : " + err.Error() + " port : " + strconv.Itoa(healthPort))
    }
}()
The package will take care of executing the function at the needed intervals, and keeping the result in memory. Making the request to the end points very fast and virtually free. Our first approach to the problem was the opposite way. Each time and endpoint was hit, it was when the registered health checks were executed. It was simple to implement but soon we discovered many problems:
- Denial of Service. You could take down a dependency due to many health checks being done.
- Timeouts. If a dependency was timing out for some reason, the health check was also very slow (it had to wait until the timeout was reached to respond).
- Complexity. If you wanted to cache some of the results, each health check had to implement its own “caching” mechanism.
Hence we rewrote it and turned the responsibilities around.
One final thing that was very important for us was to add tags or filters to the checks. In our case we had to depend on some external services that sometimes were very unreliable. We could not change them, and we wanted to be informed of the problems but lowering the thresholds to reduce the noise to the people on call.
That’s why we came up with the tags. Tags are arbitrary strings that you can pass when registering the checks. And those can be queried using the /health/status path. If you hit /health/status/tag it will respond only with the status of the checks that have that tag if any.
That way we could separate internal and external systems, the required ones and the nice to have, etc. And for each of those groups, we could have different monitors with different thresholds.
If you hit the path /health/status then it responds with all the registered checks, no matter the tags.
All our Go projects always had hlthrr exposing those checks. It gives the people developing the service that autonomy and responsibility to implement the checks that they consider important for their service.