Canvas, browser and the sun
Posted on by álvaro
Lately I have been learning on how to use the HTML Canvas to generate nice images. It is a work in progress. For that I have followed part of the Creative Coding course (really nice one if you want to get started). And the same guy has created the nice canvas-sketch tool to get the basics of the workflow going.
As one of my first tries in this world of creative coding has been playing with the sun trajectories in the sky. Getting things done in Javascript is very fast, and usually you have already in npm some library to help. In this case I started to research on how to calculate the Sun position, but then I discovered that there is already a package doing that much better.
You can find the code of my experiments under the solecito in GitHub. There is a folder with different images I have generated and you can see the commit history to see the different experiments I have tried.
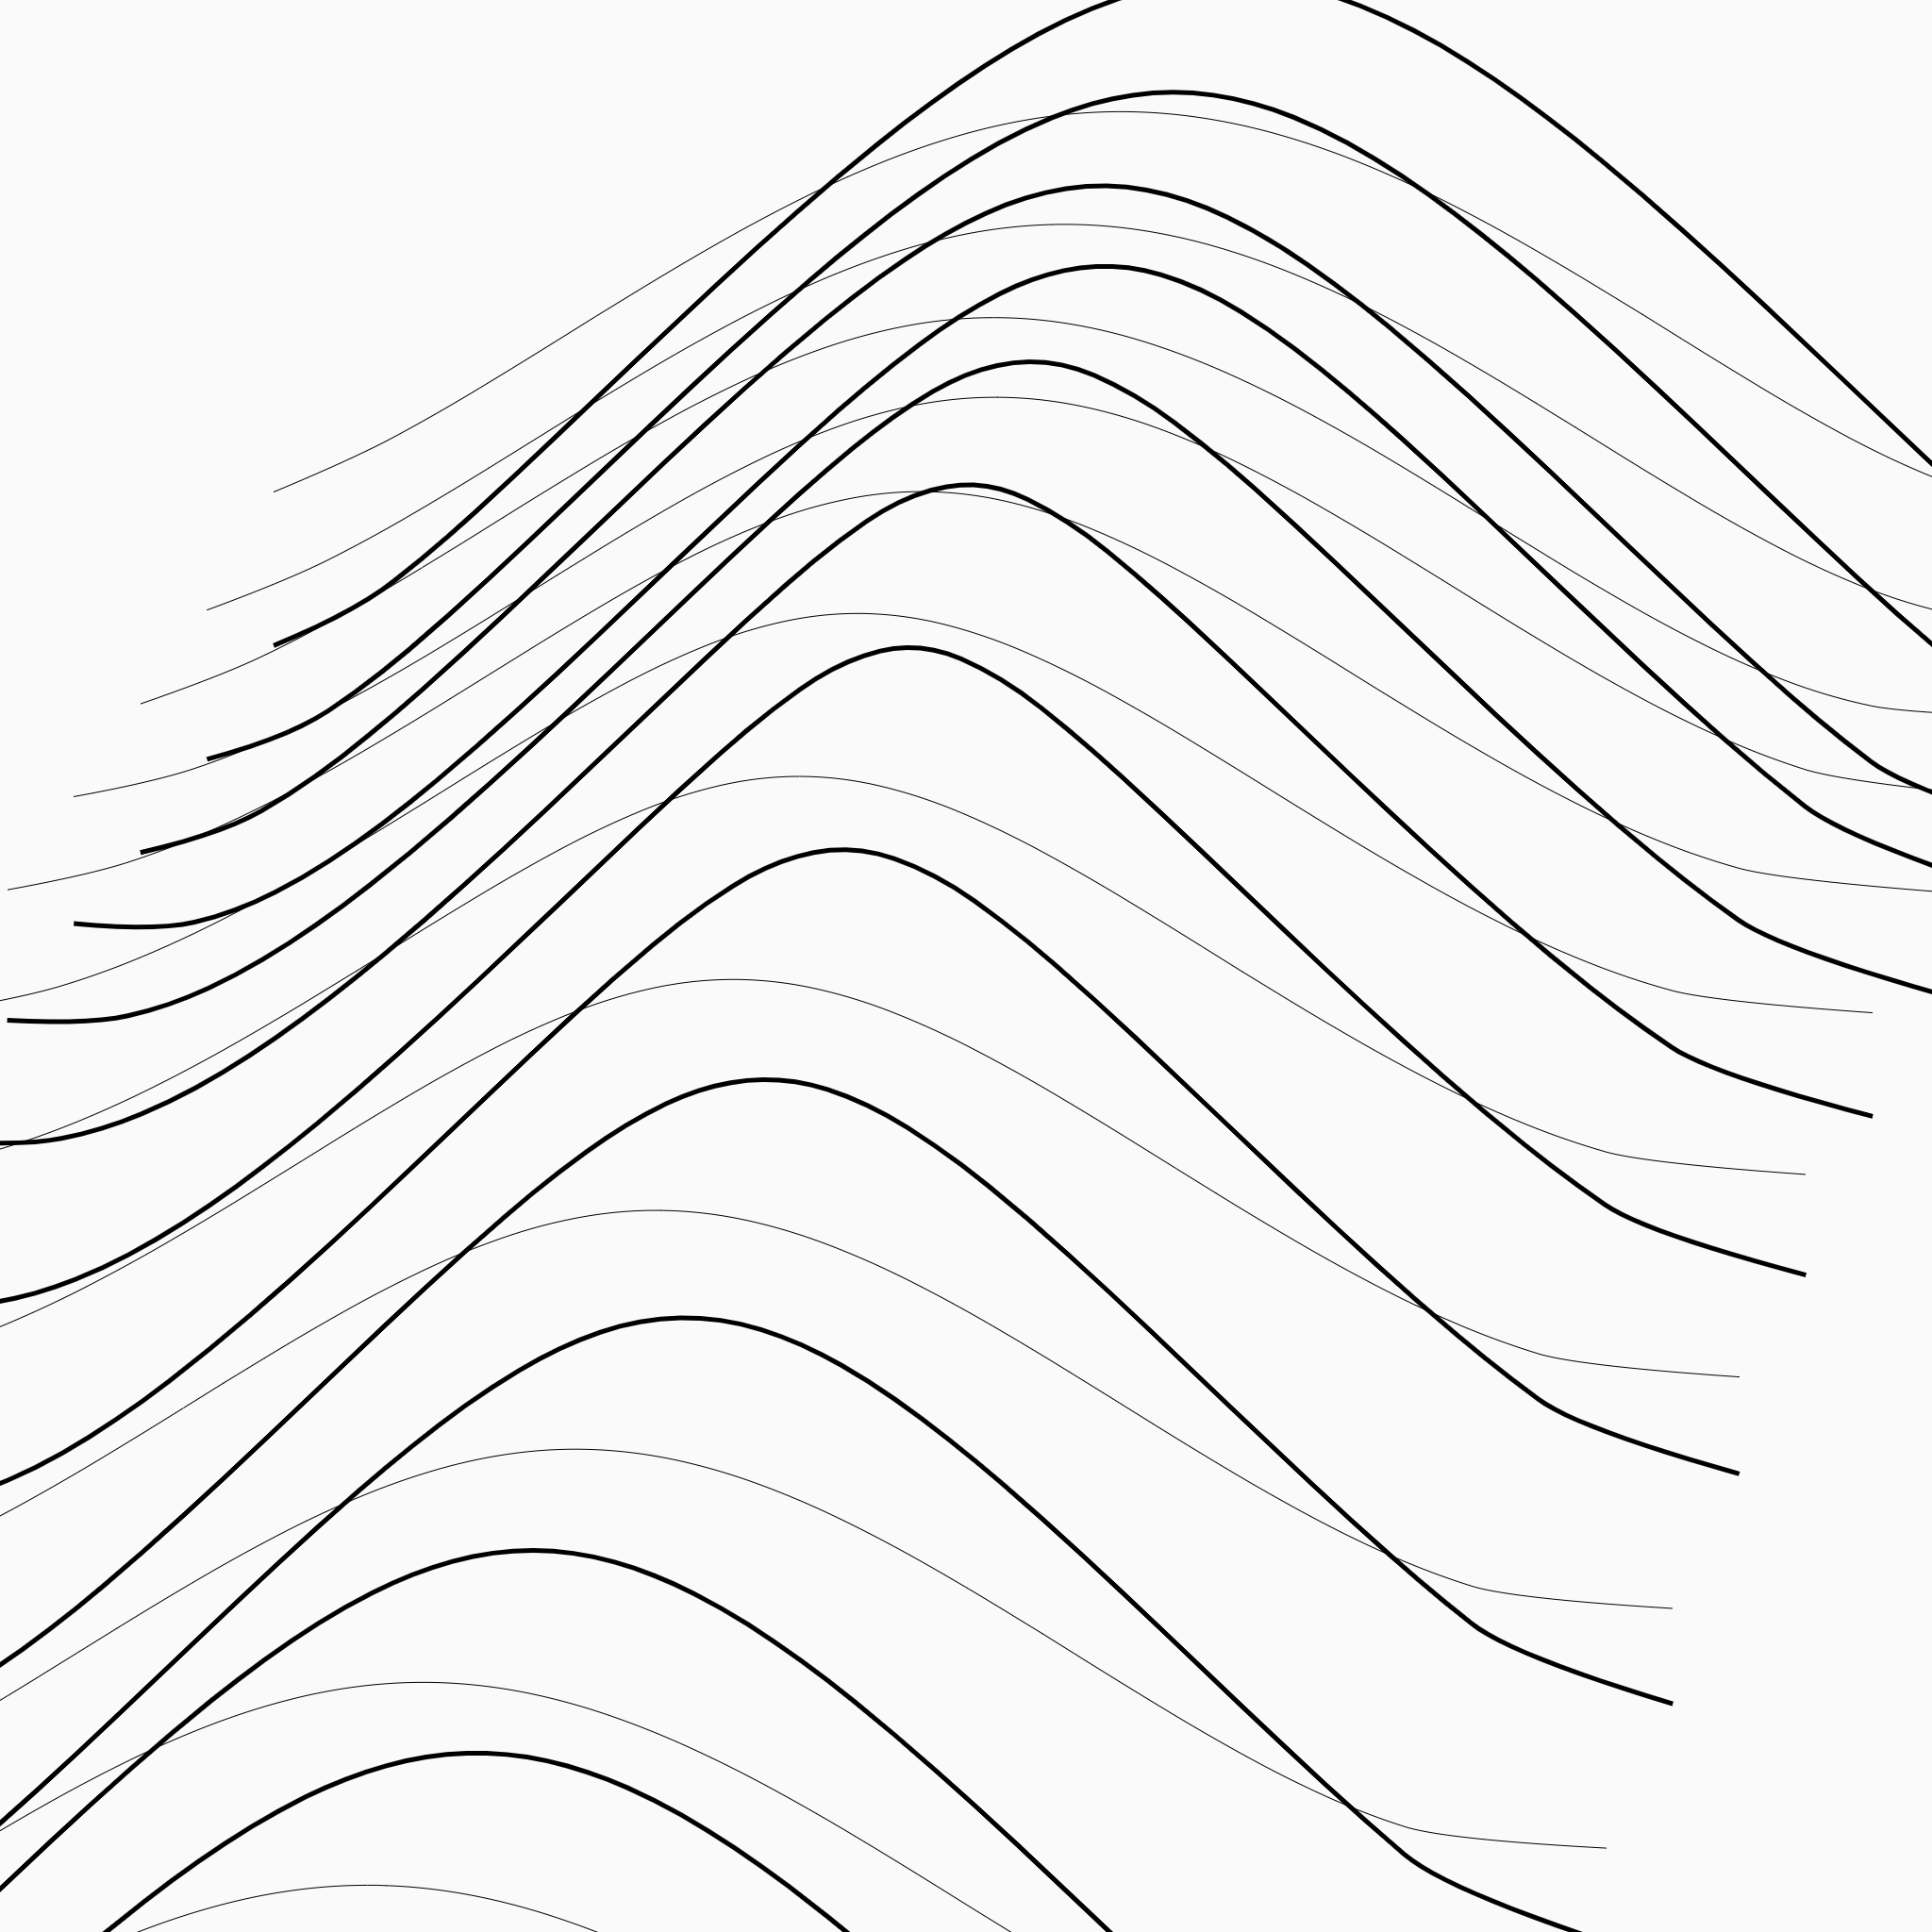
In my first experiment I wanted to visualize how different are the trajectories (only the altitude) of the sun in Madrid and in Helsinki during the year.
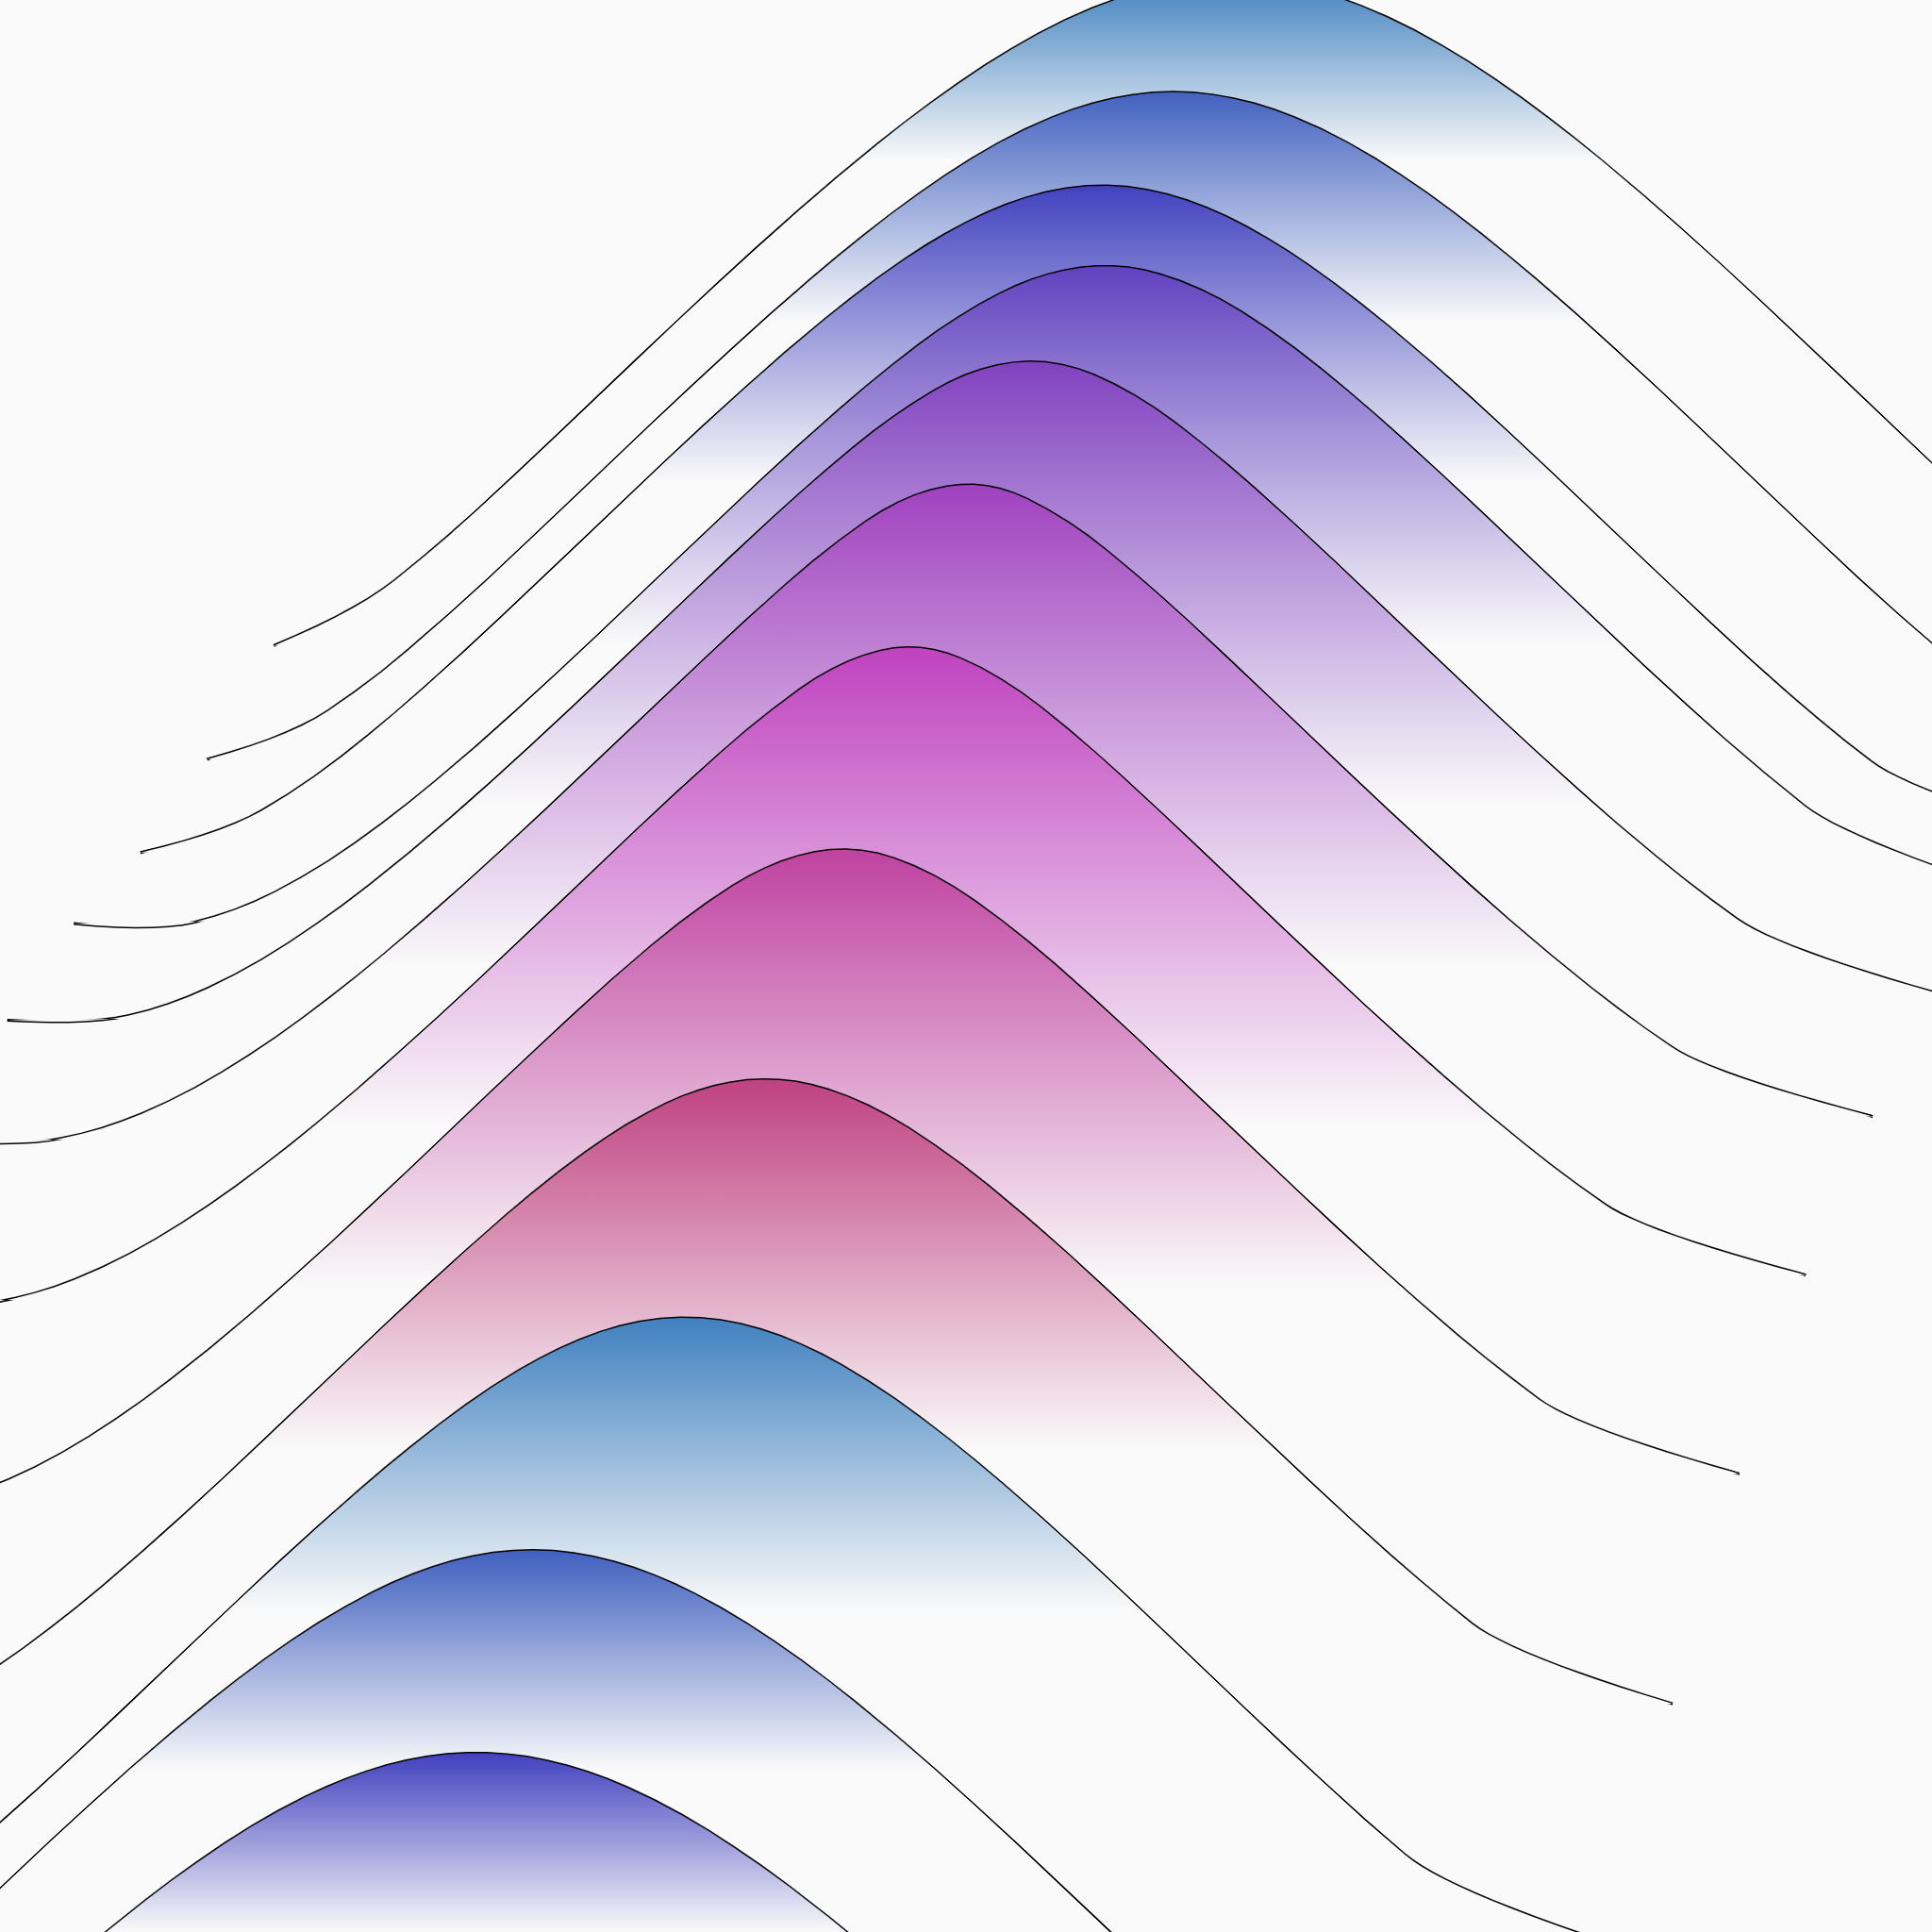
Afterwards as I hadn’t used the gradients before, without spending much time on choosing colors, using the same sun altitudes in Madrid but colored.
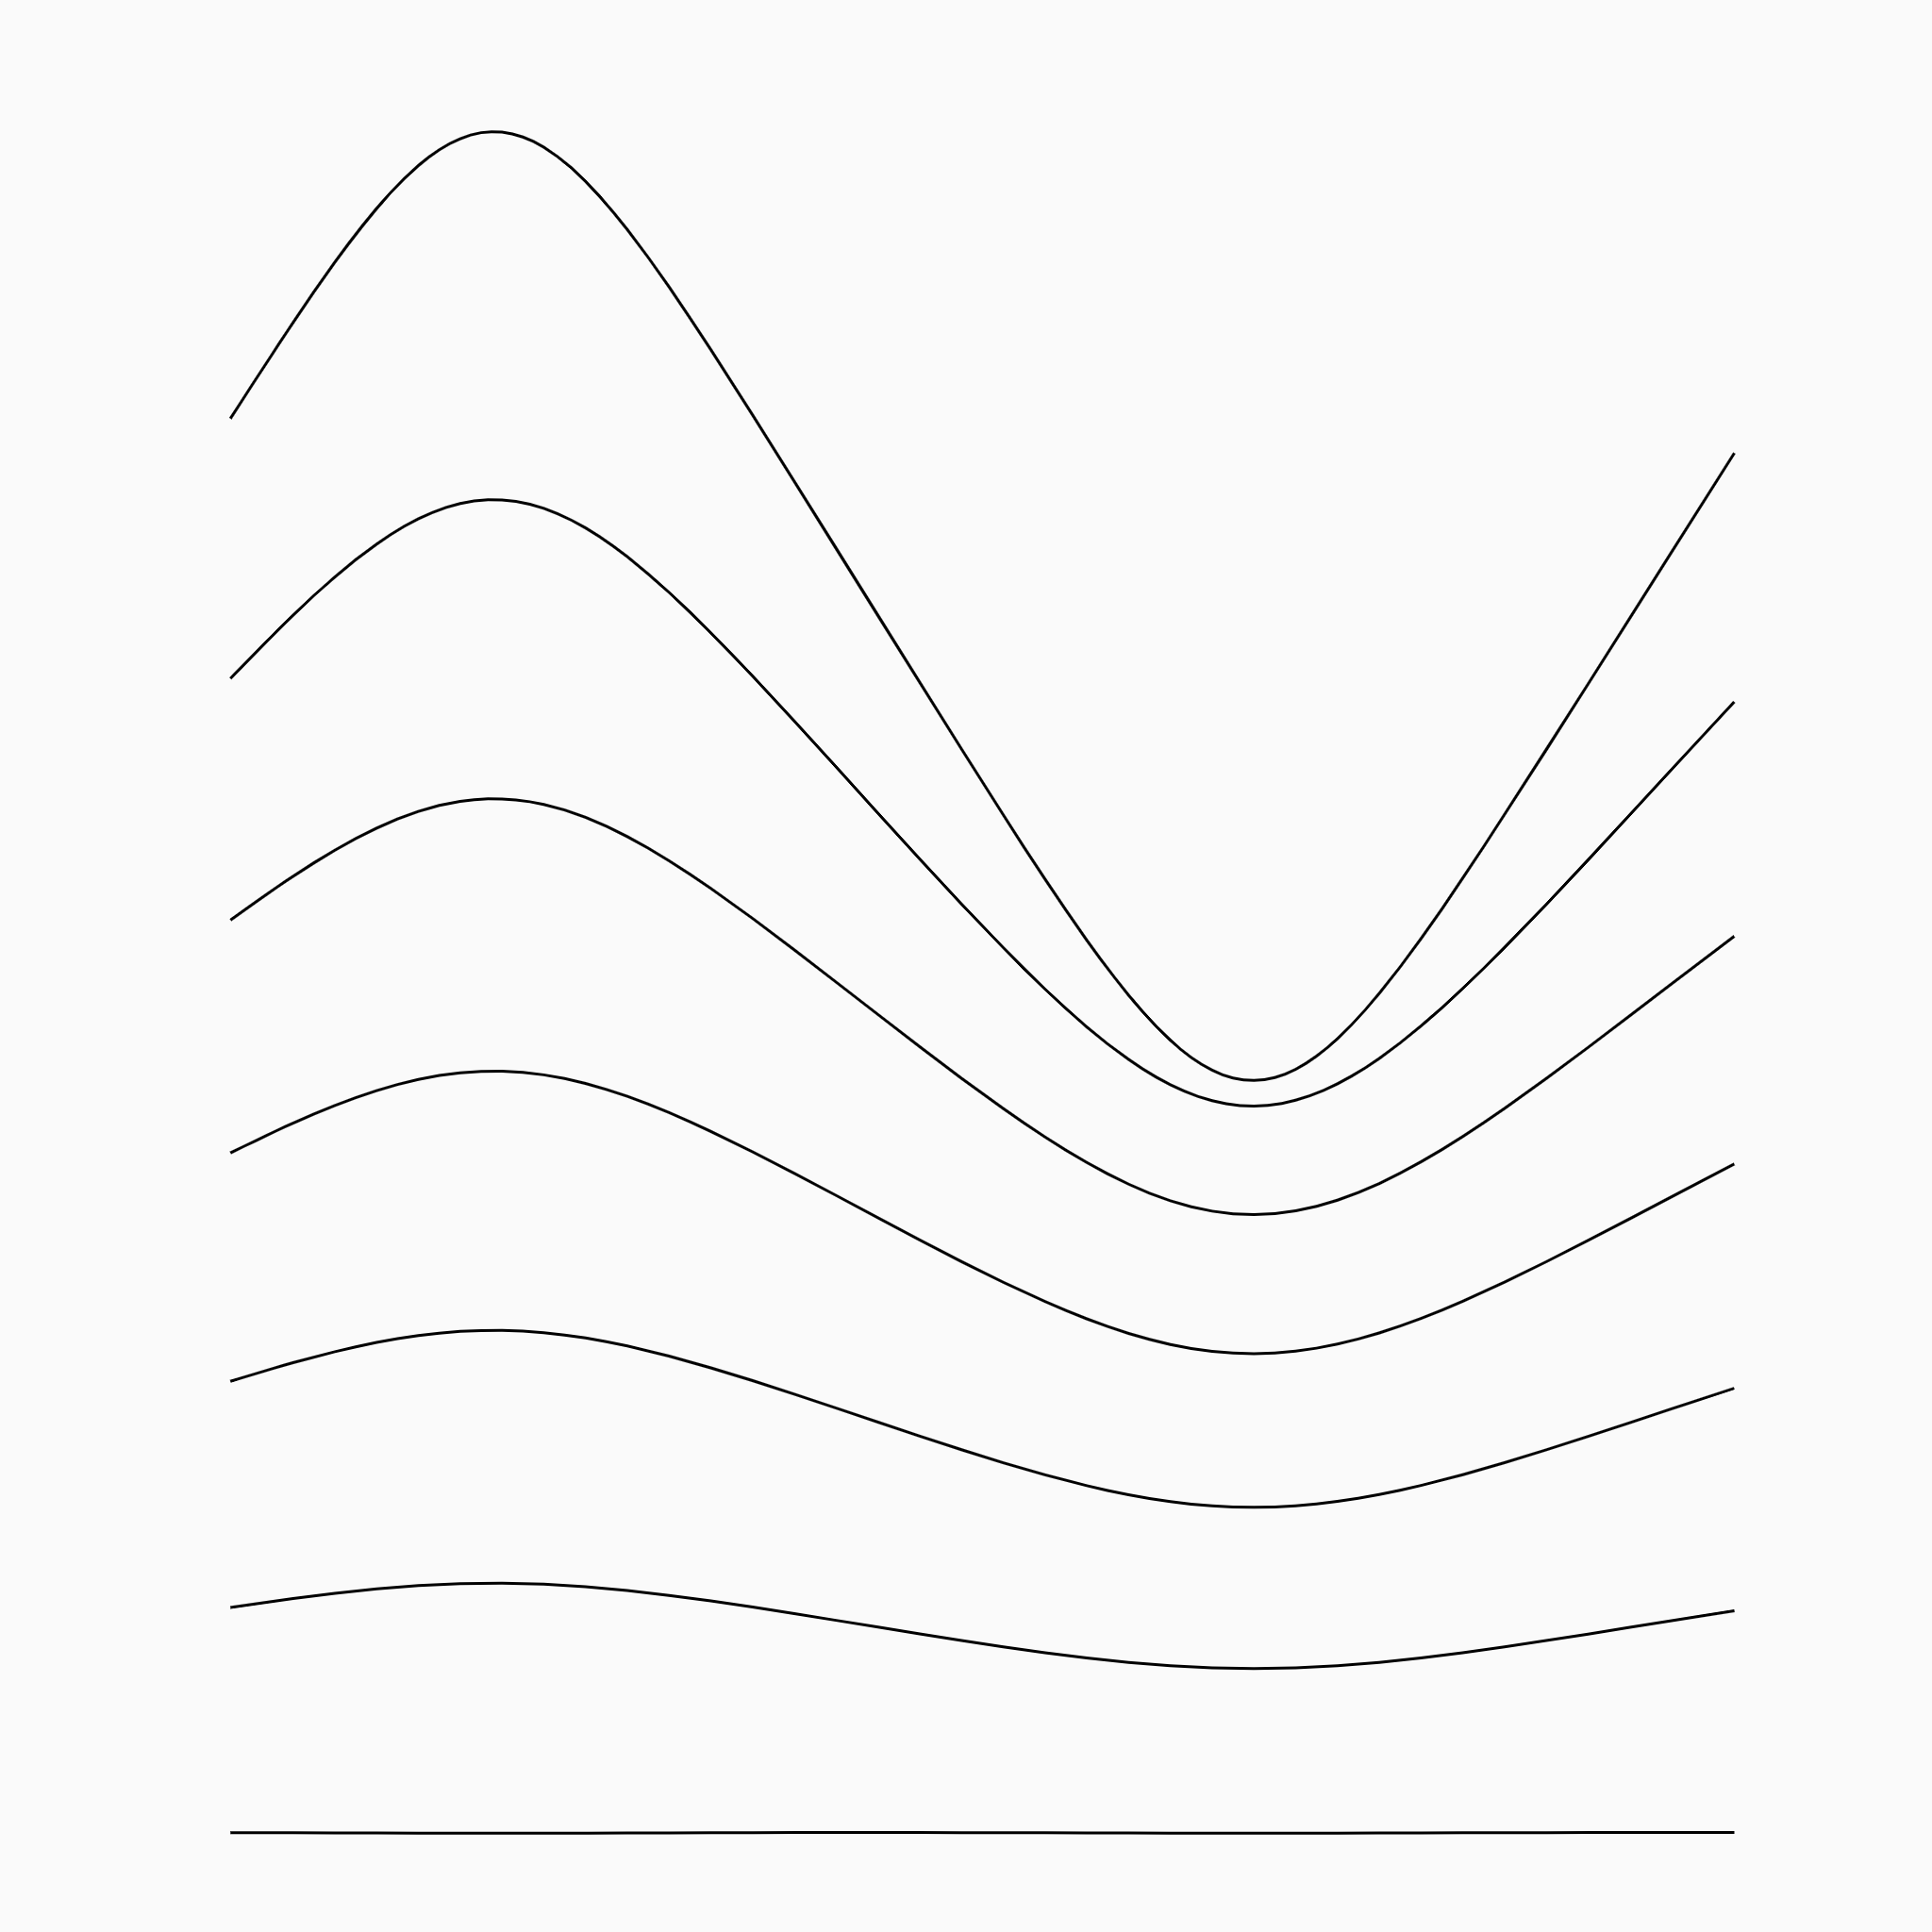
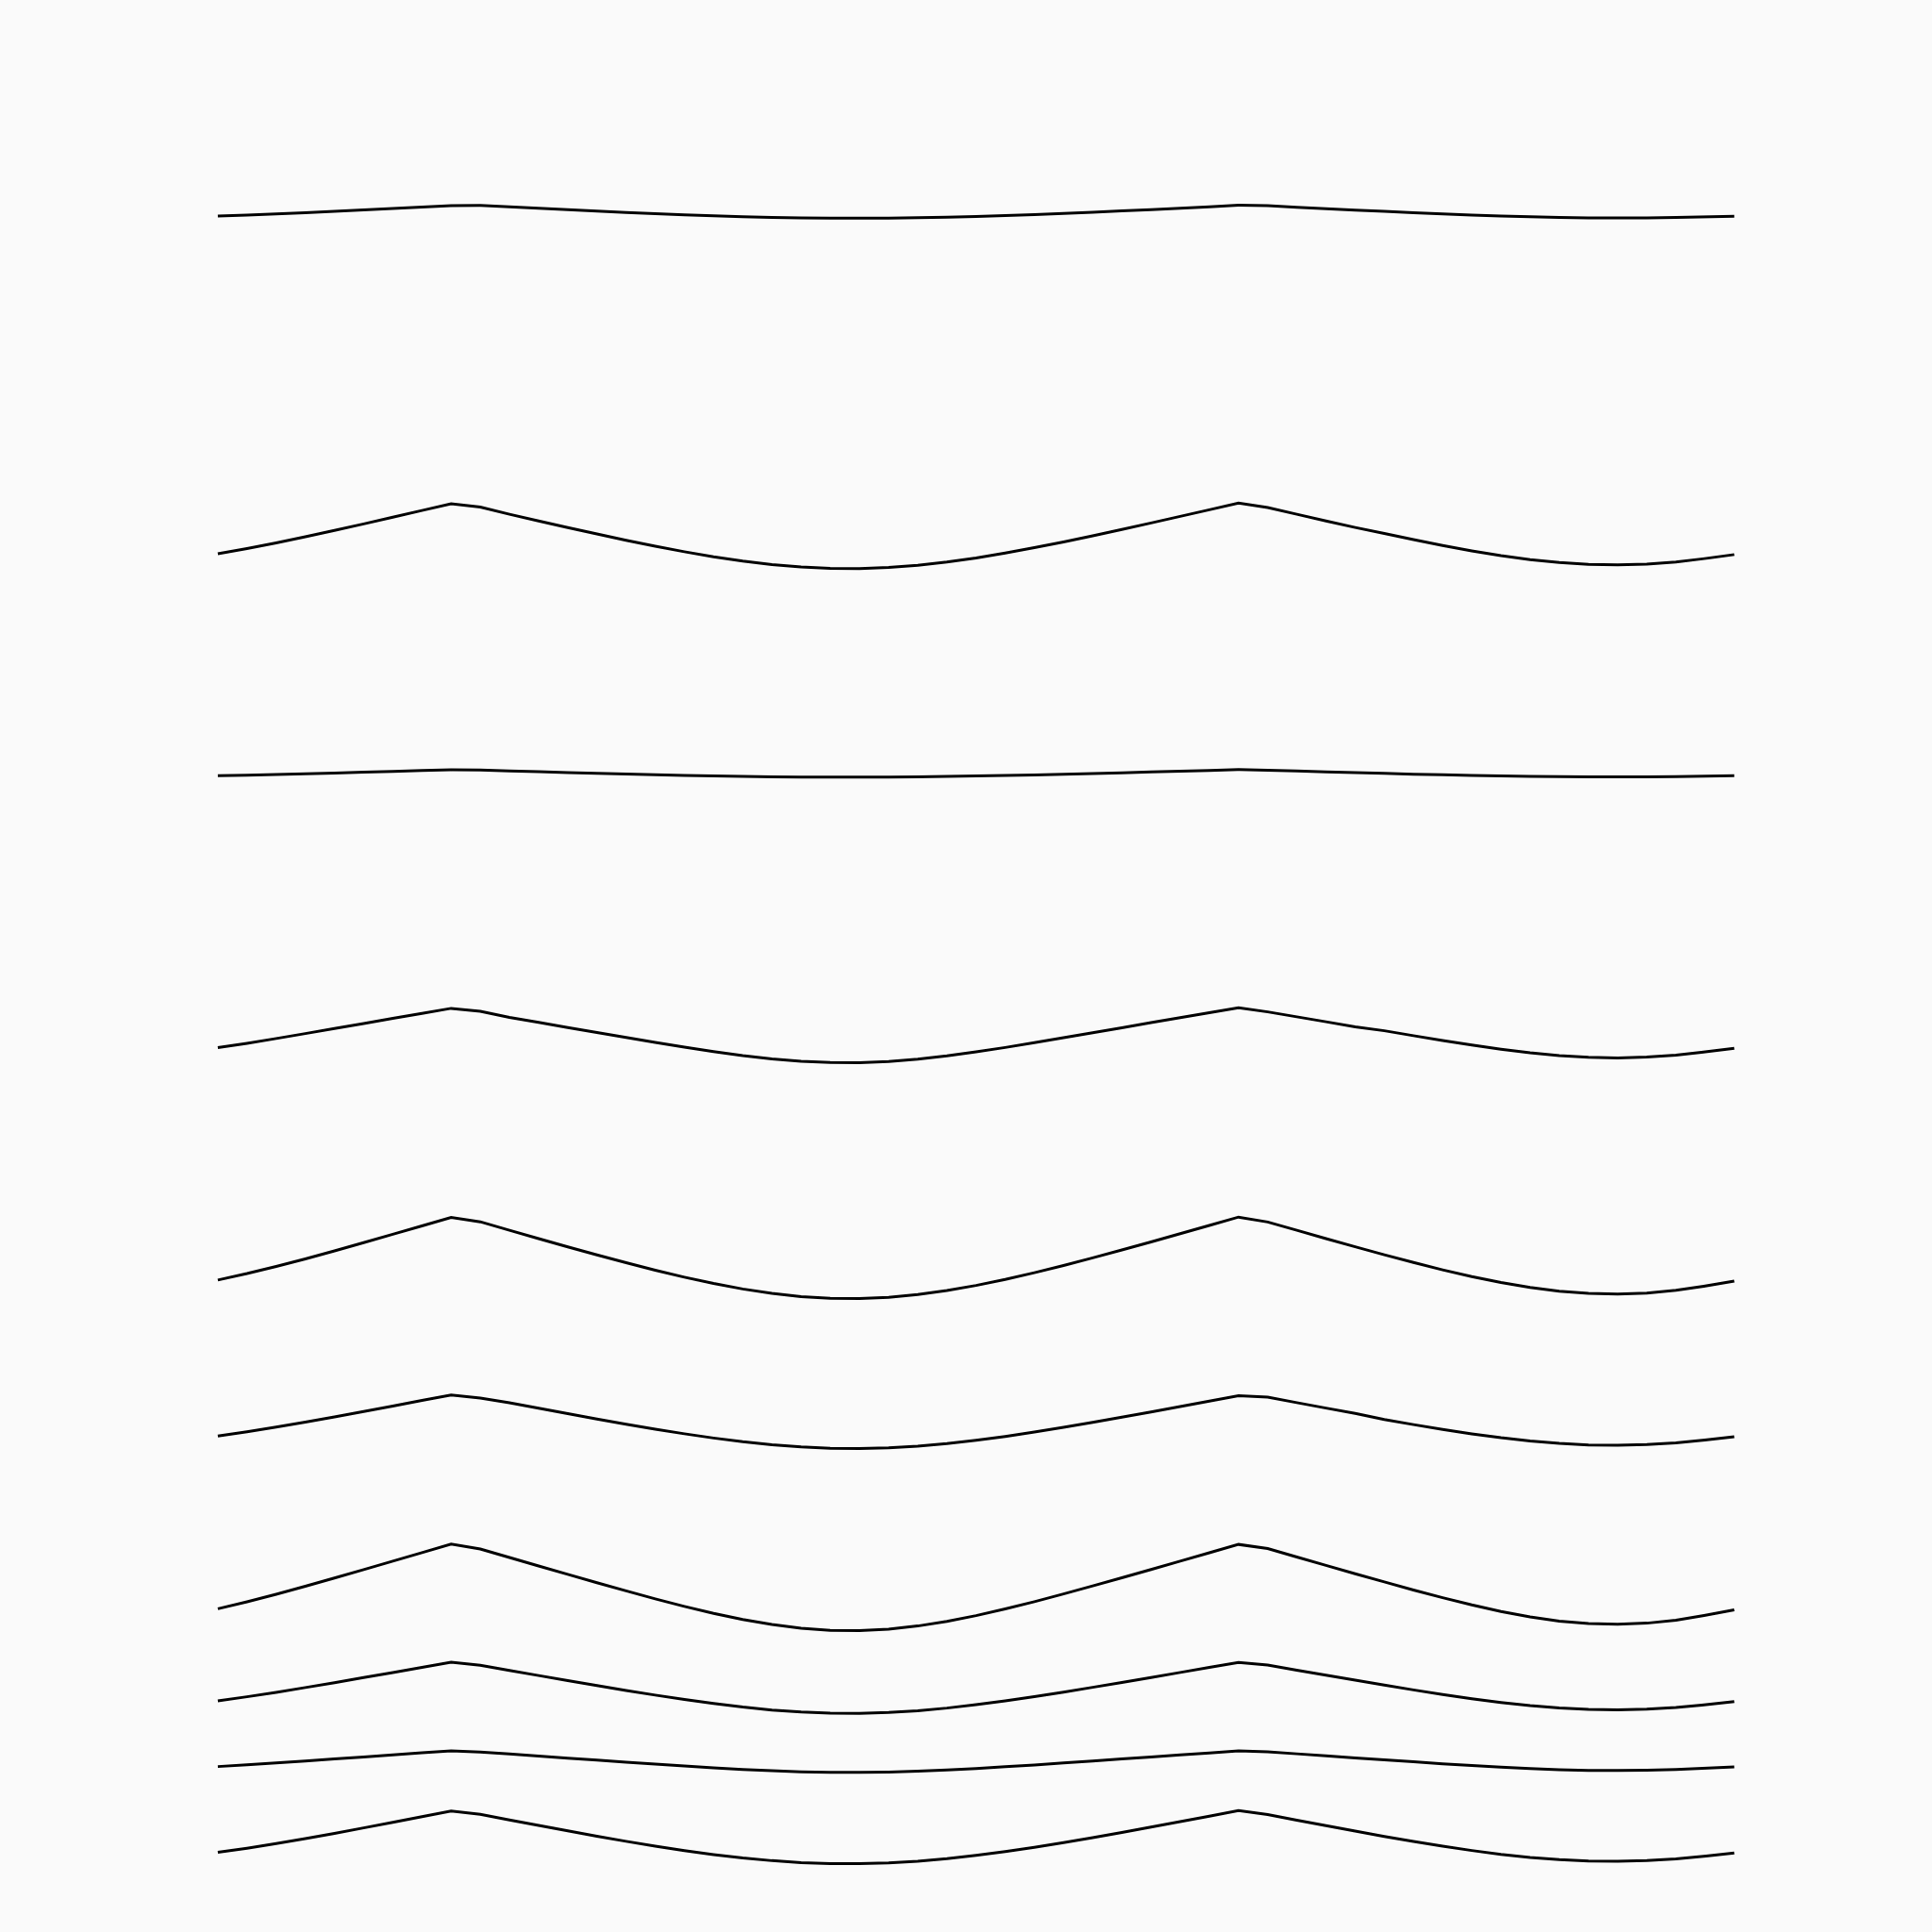
Next experiment was changing the source of data. In the previous ones we displayed the sun altitude, but now is the number of hours the sun is above the horizon for different latitudes (during the year). At the bottom you can see the equator (they always have the same day length), at the top is 70º North.
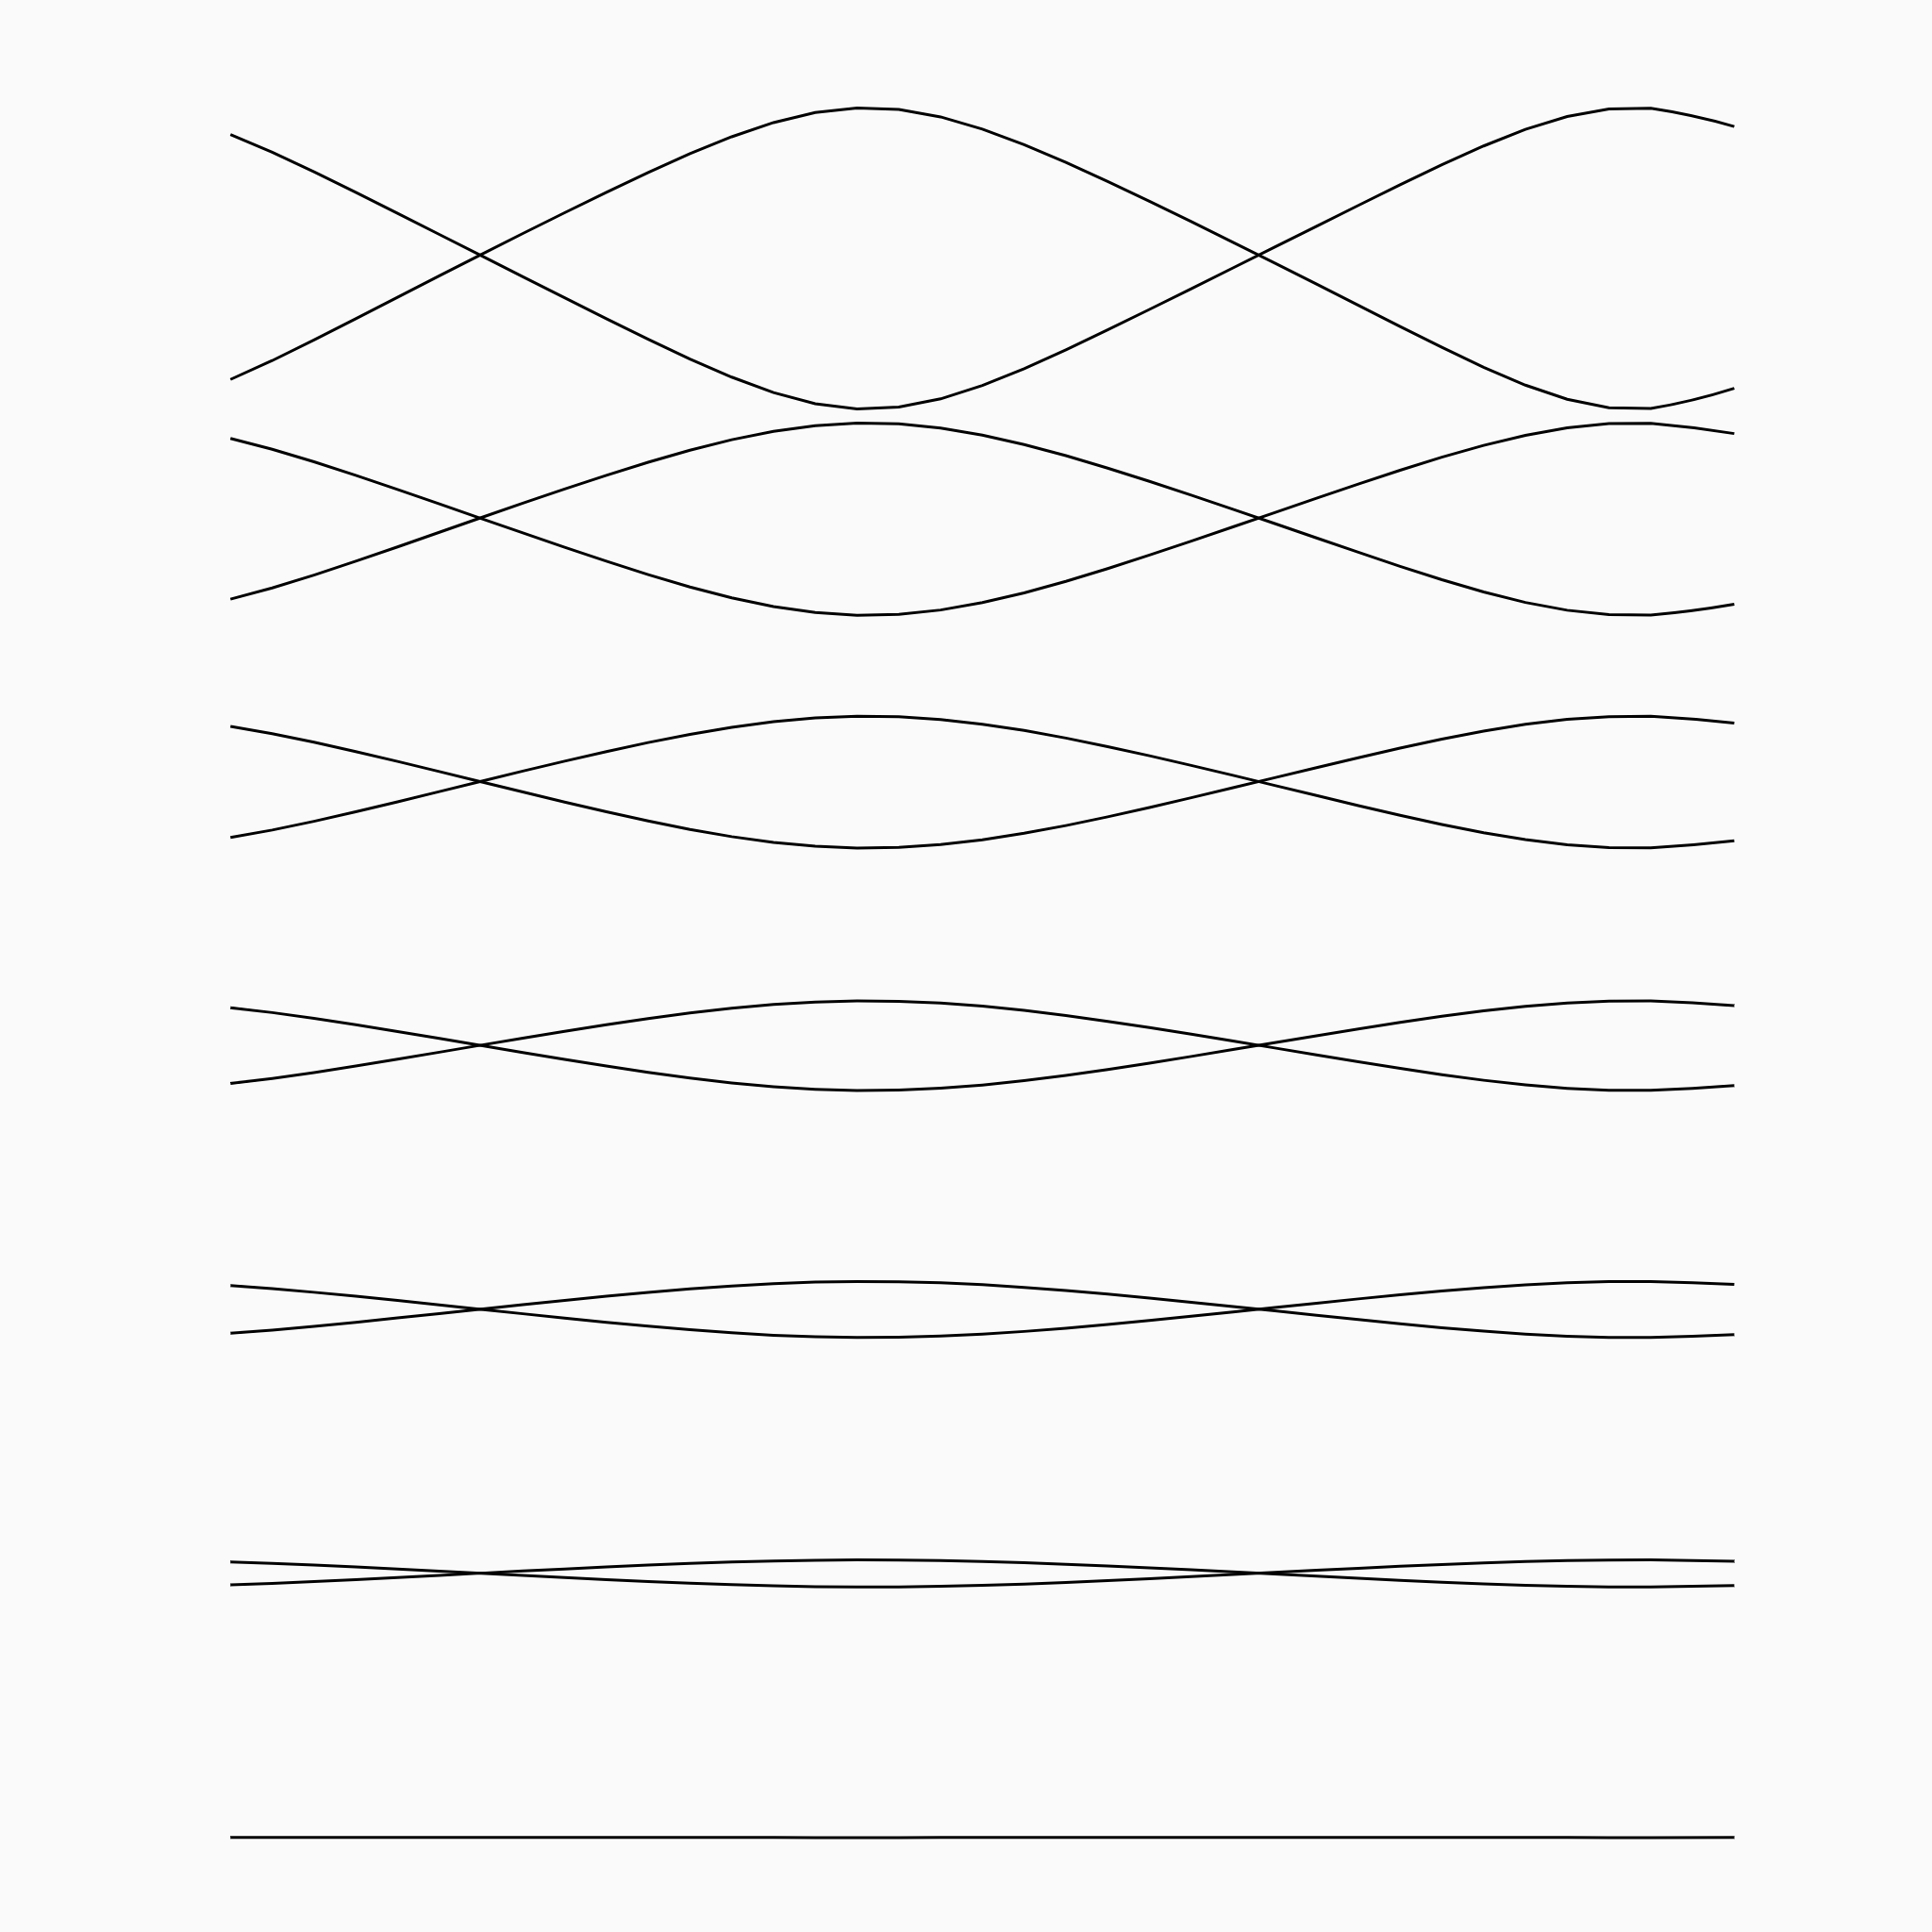
But what about if we compare the hours of light in the North and South hemisphere?
And as the last of my experiments so far, is to calculate the difference of sun hours in two random positions on the Earth during the year.
I will keep experimenting, and at some point I will print them to decorate my house.
