Managing Redash from Code
Posted on by álvaro
In my company we use Redash quite a lot to display vast amount of information. If you don’t know Redash, maybe you should check it out, it is an open source tool that connects to many different DBs and you can run SQL queries and generate many graphs out of them. It is quite powerful and simple to use. Of course it does not have the flexibility of coding things directly, but for the basic use cases it is really fast.
And as I was saying we use it quite extensively, in fact we even embed those resulting graphs in other systems. The problem that we found is that we couldn’t manage the queries and graphs as any other source code. They were living in a Postgres database, were we could not version control them, etc.
Not having them as code was even worse, as the product we develop it is multi tenant and we have to deliver the same set of graphs for many different customers. And managing all those graphs was very hard and complicated.
In the end we decided to create redpush. It is a tool to define your queries and graphs in YAML (yes, more of it). It uses (and abuses) the same API that the web frontend. Currently it supports the latest branch of Redash (at the time of writting) which is 5.x
It is developed in Python, but if you want to run it, the easiest way to do it is using the Docker images already available.
docker run -v /Path/To/Your/conf:/conf comptel/redpush:master push --redash-url http://host.docker.internal:5000 --api-key YOUR_USER_KEY -i /conf/my_conf_file.yaml
And example of how you will define a query is something like:
- name: 'An example query'
  description:
  redpush_id: 1002  # some UNIQUE ID that will be used to track this query
  query: |-
    SELECT * FROM Purchases
  data_source_id: 1
  visualizations:
  - description: ''
    redpush_id: 2 # some UNIQUE ID (inside the query) that will be used to track this visualization
    redpush_dashboards:
      - name: my-business # the name of a dashboard were to add this visual
        row: 1   # in which row you want this graph
        col: 0   # in which column, can be [0,1,2]
        size: small  # size of the widget, a row fits: 3 small, 2 medium, 1 big
    type: CHART
    options:
      bottomMargin: 50
      error_y:
        visible: true
        type: data
      minColumns: 2
      series:
        stacking: stack
        percentValues: false
        error_y:
          visible: true
          type: data
      globalSeriesType: line
      yAxis:
      - type: linear
        title:
          text: Purchases
      - rangeMax: 1000
        type: linear
        rangeMin: 0
        opposite: true
        title:
          text: ''
      minRows: 5
      sortX: true
      defaultColumns: 3
      xAxis:
        labels:
          enabled: true
        type: datetime
        title:
          text: ''
      defaultRows: 8
      customCode: |-
        // Available variables are x, ys, element, and Plotly
        // Type console.log(x, ys); for more info about x and ys
        // To plot your graph call Plotly.plot(element, ...)
        // Plotly examples and docs: https://plot.ly/javascript/
      legend:
        enabled: false
    name: Chart
I know, it is quite verbose, but Redash has many tweaking parameters.
Details
Redpush needs to be able to track the queries created by itself. And in fact it is safe to run it many times (operations should be idempotent). How it does it is abusing a little the REST API. It creates a new id, the redpush_id that you will need to add to the queries managed. That id needs to be unique for a query in a redash deployment. And it will be used to track the query during its lifetime.
The same idea is also applied for visualizations. A redpush_id is used also for each visualization of a query (but in this case it needs to be unique only per query, not globally).
Dashboard layout
Redpush has three sizes of widgets, which can be easier seen in the following diagram¡:
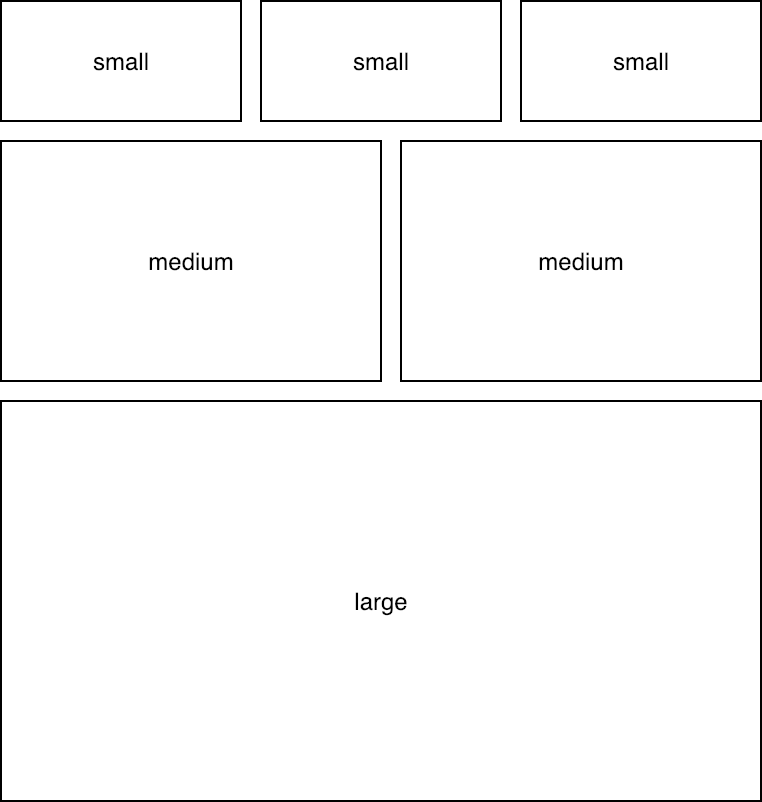
You need to arrange the column and row taking into account:
- Start counting from 0.
- Rows don’t need to be consecutive. You can have row 1 and 4, but not 2 and 3.
- Widgets float to the top left. So if you leave room where the widget will fit on the top/left they will float there.
Workflow
My usual workflow to be able to manage queries as code is the following:
- I have a dev redash, which I use to play around until I have what I want.
- Then I used
redpushto dump the contents of that dev environment.python redpush/cli.py dump --redash-url https://MY_REDASH_SERVER --api-key YOUR_KEY -o dev.yaml(or using Docker as shown above) - With your favorite editor, open that (maybe long) YAML and find the query you want to productize.
- Copy paste it to the config file you use for your production environment.
Do the needed tweaks:
- remove the
idfrom query and visualization. - optional remove the first entry of visualizations as it is the default table and Redash will add it again.
- Add the mandatory
redpush_idto the query. To the visualizations you may have:
- Add the mandatory
redpush_id(this id needs to be unique not globally but only for this query. - If you want to add them to a dashboard, then indicate it:
- name: my-dashboard-name row: 8 # counting from 0 col: 1 # counting from 0. In a row can be: 3 small or 2 medium or 1 large size: medium # can be small, medium, large- Add the mandatory
- remove the
Does it really work?
We use it to manage more than a thousand graphs. As I mentioned we do them for many customers and we have a template engine as a previous step to generate the YAML that will be uploaded. I will try to show that in a future entry.